

Fusion: Dot Matrix Display for a Drip Coffee Machine

Fusion: Dot Matrix Display for a Drip Coffee Machine

Fusion: Dot Matrix Display for a Drip Coffee Machine

11
UI Design
Animation
Wireframing
Year

2026

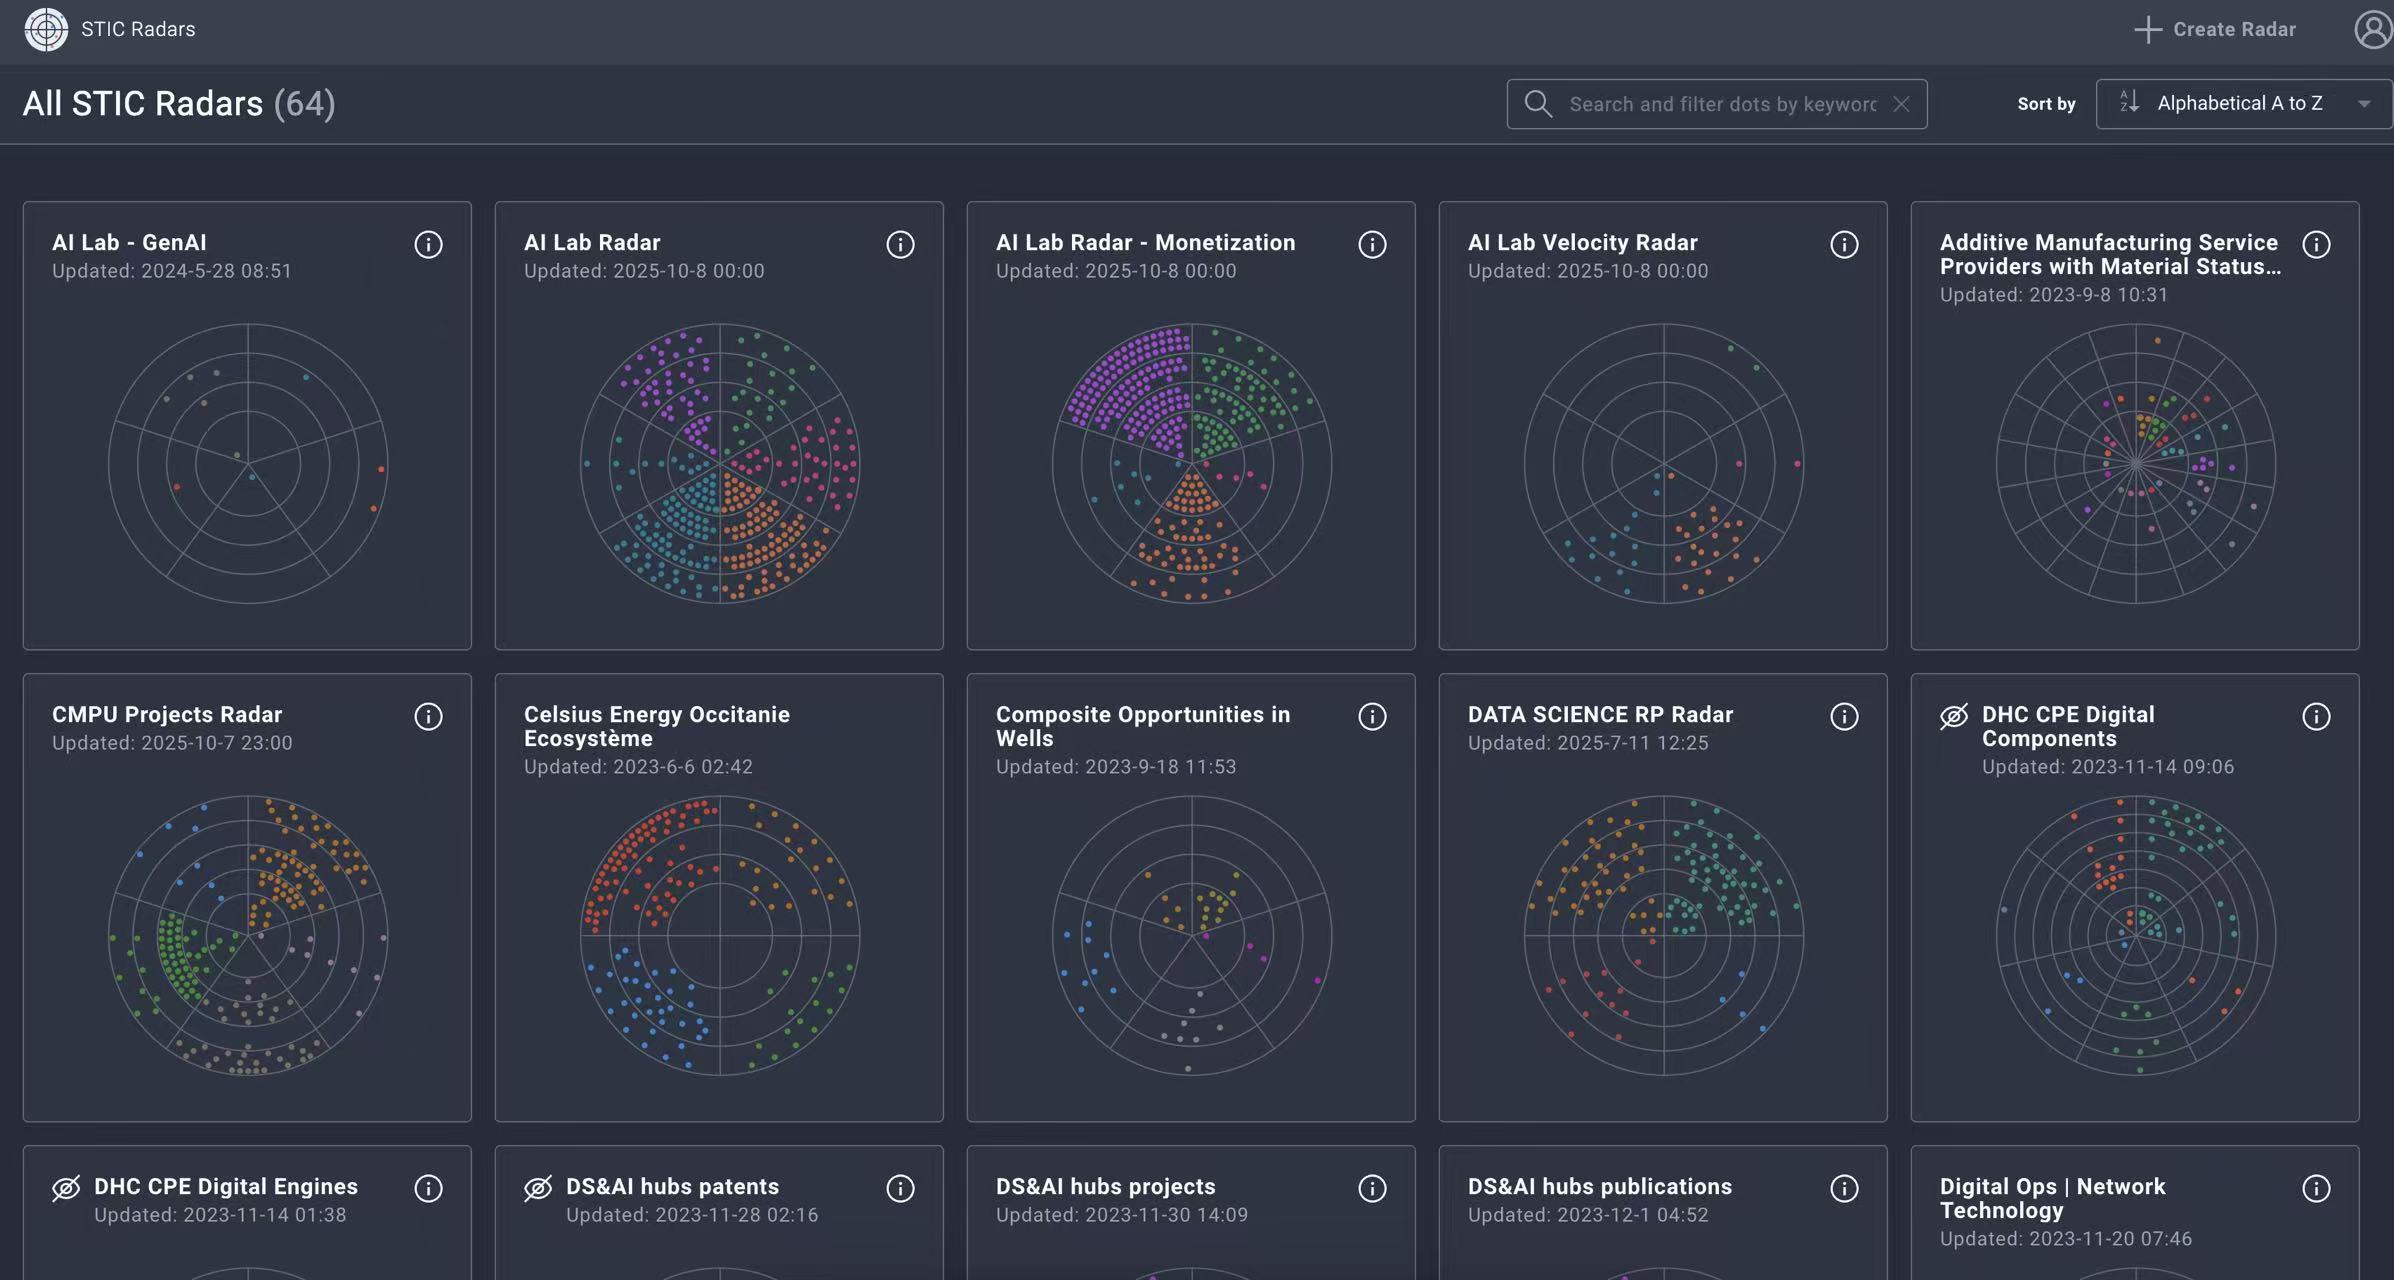
What radar pages look like

What radar pages look like

What radar pages look like

Discover Bigger Picture

Discover Bigger Picture

Discover Bigger Picture

Build Depth for Personalized Path

Build Depth for Personalized Path

Build Depth for Personalized Path

Gradient 1 - Blue
Gradient 2 - Purple
Gradient 1 - Blue
Gradient 2 - Purple
Gradient 1 - Blue
Gradient 2 - Purple

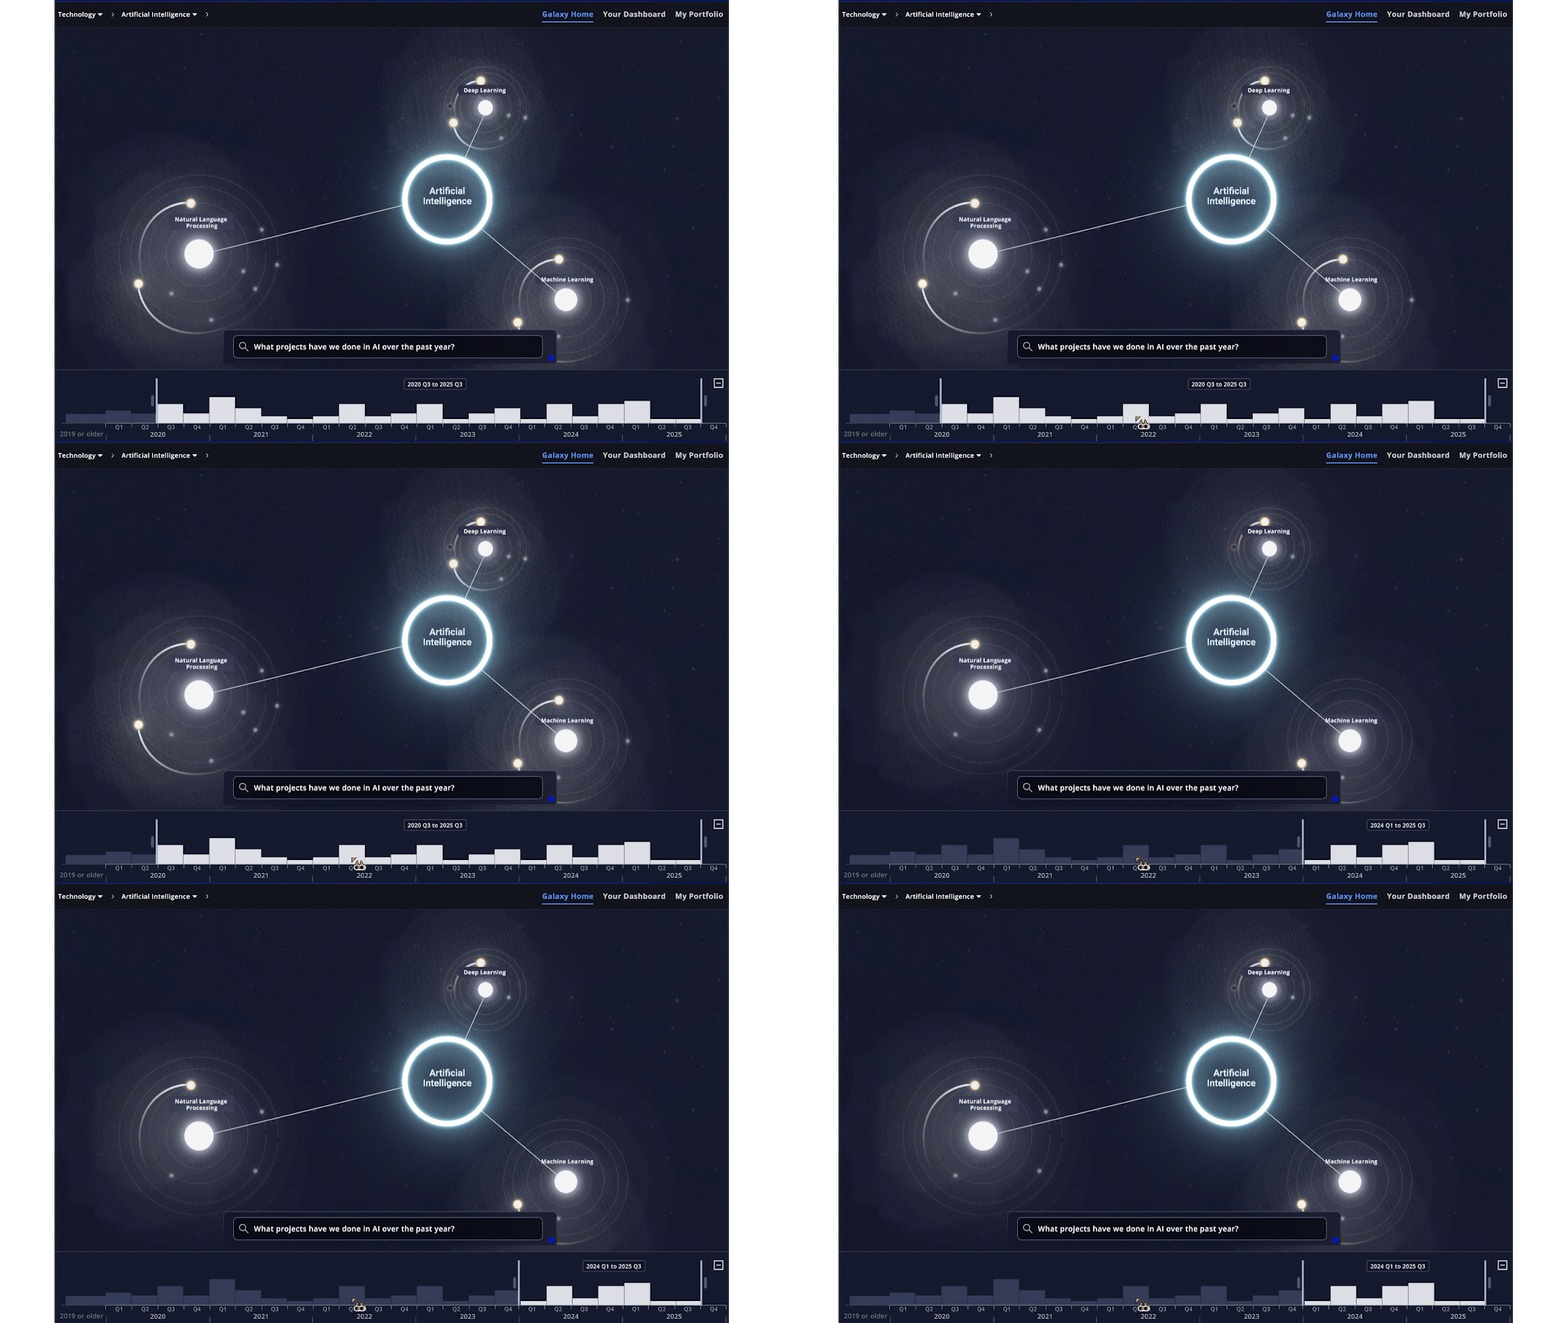
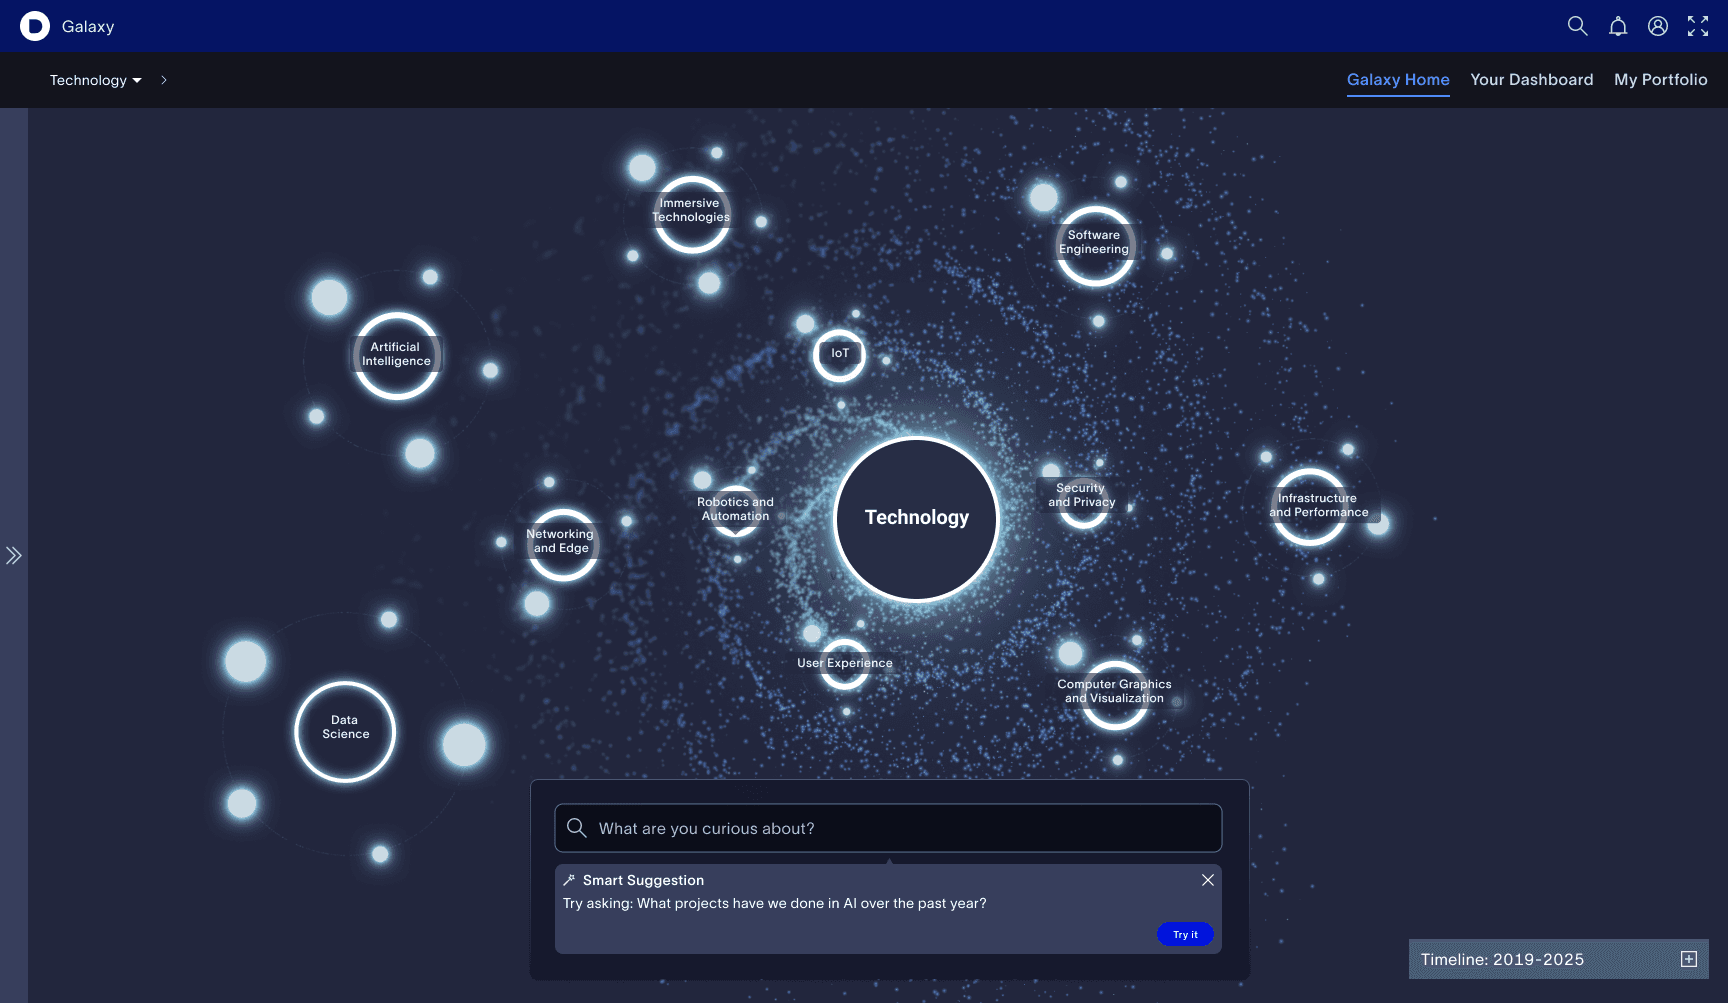
Galaxy Visualization: Enables open-ended exploration, revealing hidden connections through an intuitive, visual map.

Galaxy Visualization: Enables open-ended exploration, revealing hidden connections through an intuitive, visual map.

Galaxy Visualization: Enables open-ended exploration, revealing hidden connections through an intuitive, visual map.

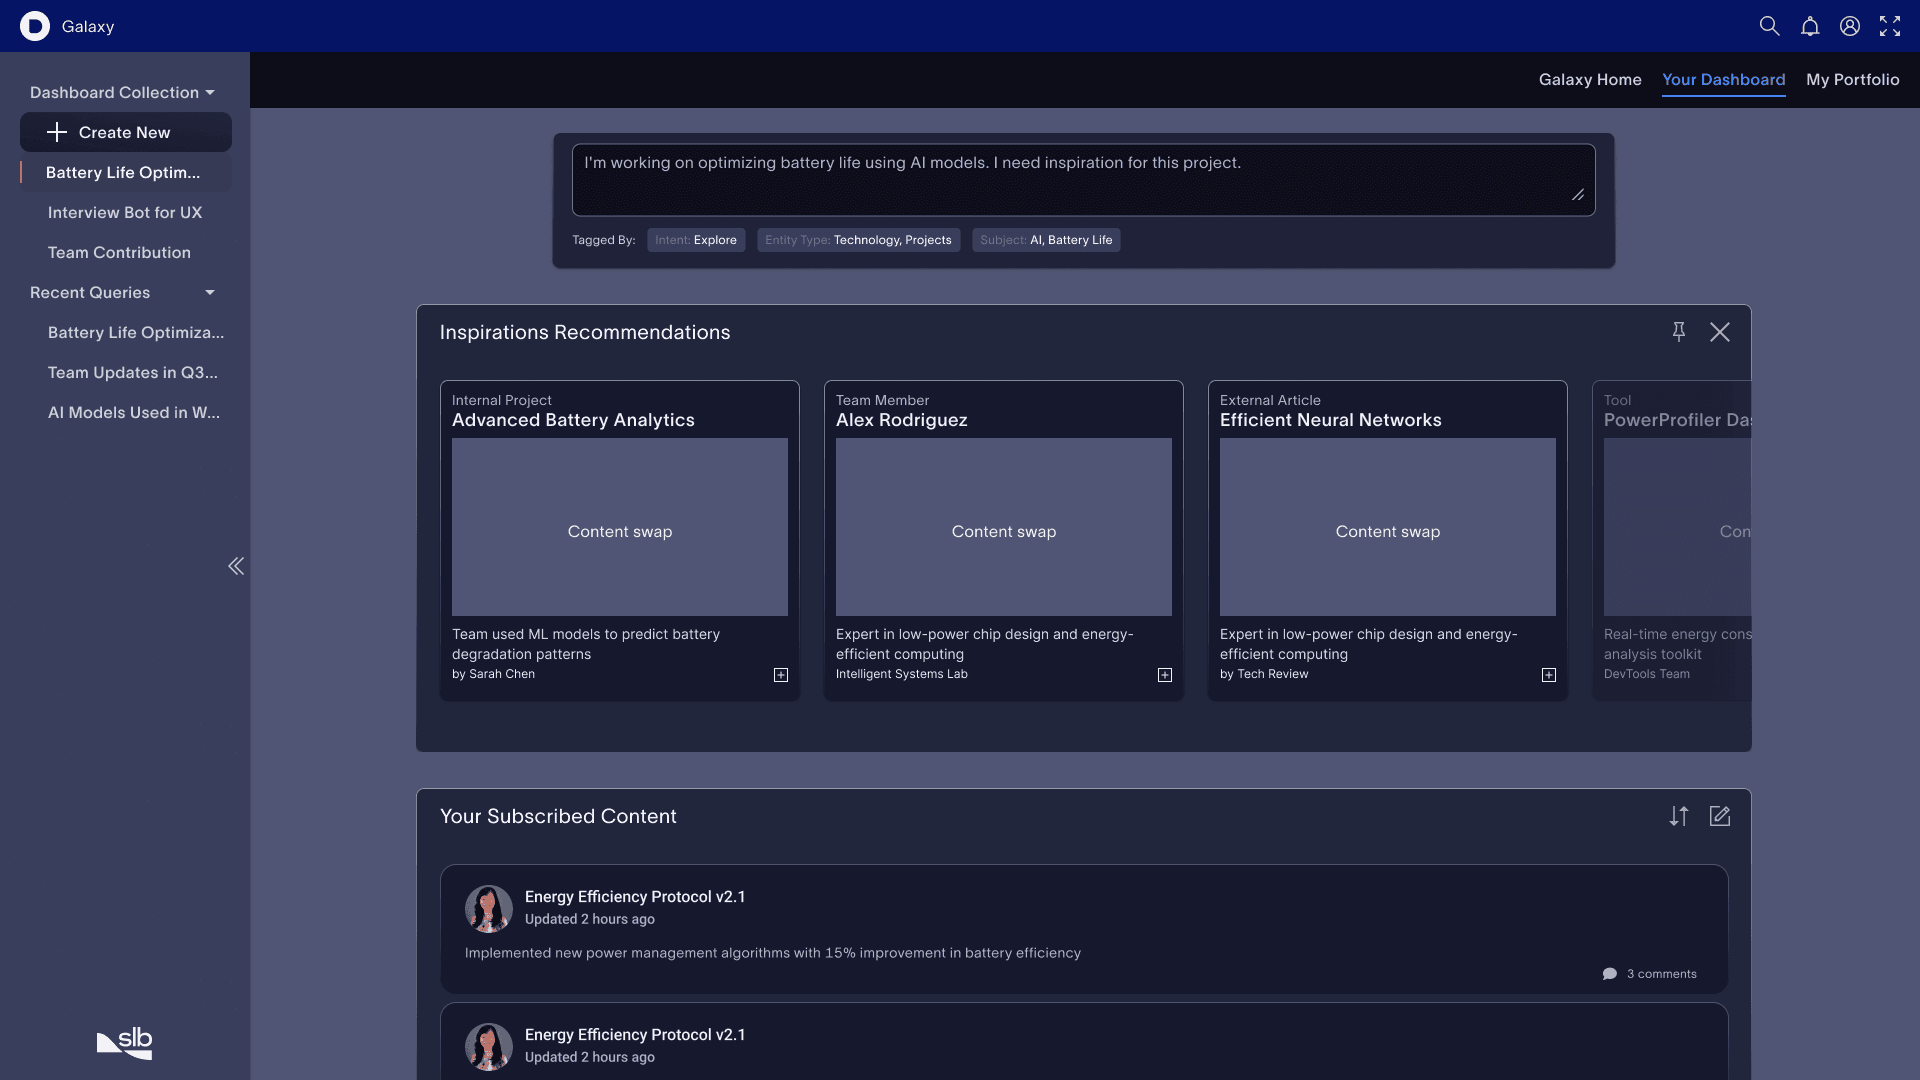
Personal Dashboard: Adapts to individual roles and goals, surfacing timely, relevant insights that support day-to-day decisions.

Personal Dashboard: Adapts to individual roles and goals, surfacing timely, relevant insights that support day-to-day decisions.

Personal Dashboard: Adapts to individual roles and goals, surfacing timely, relevant insights that support day-to-day decisions.

Technology View

What it does: Groups projects by the technologies they apply or explore.

  • Hierarchy: Tech field → Specific methods/models → Projects

  • Why it’s helpful: Ideal for identifying innovation trends, technical overlaps, or evaluating tech adoption maturity.

Technology View

What it does: Groups projects by the technologies they apply or explore.

  • Hierarchy: Tech field → Specific methods/models → Projects

  • Why it’s helpful: Ideal for identifying innovation trends, technical overlaps, or evaluating tech adoption maturity.

Technology View

What it does: Groups projects by the technologies they apply or explore.

  • Hierarchy: Tech field → Specific methods/models → Projects

  • Why it’s helpful: Ideal for identifying innovation trends, technical overlaps, or evaluating tech adoption maturity.

Domain View

What it does: Groups projects based on problem space within SLB, application area, or impact field (e.g., “Subsurface,” “Grid Modernization”).

  • Hierarchy: Domain → Product → Projects

  • Why it’s helpful: Useful for strategists or external partners to see applied impact areas and identify gaps or overlaps in research.

Team View

What it does: Organizes projects by contributing teams (e.g., AI Lab, Frontend, Robotics).

  • Hierarchy: Team → Sub teams within a Lab → Projects

  • Why it’s helpful: Great for internal alignment, performance tracking, and collaboration mapping across the org.

Team View

What it does: Organizes projects by contributing teams (e.g., AI Lab, Frontend, Robotics).

  • Hierarchy: Team → Sub teams within a Lab → Projects

  • Why it’s helpful: Great for internal alignment, performance tracking, and collaboration mapping across the org.

Team View

What it does: Organizes projects by contributing teams (e.g., AI Lab, Frontend, Robotics).

  • Hierarchy: Team → Sub teams within a Lab → Projects

  • Why it’s helpful: Great for internal alignment, performance tracking, and collaboration mapping across the org.

Due to the limitation of time, we didn't get to implement all the features. Below are the proposed features that are possible with available data from radar.

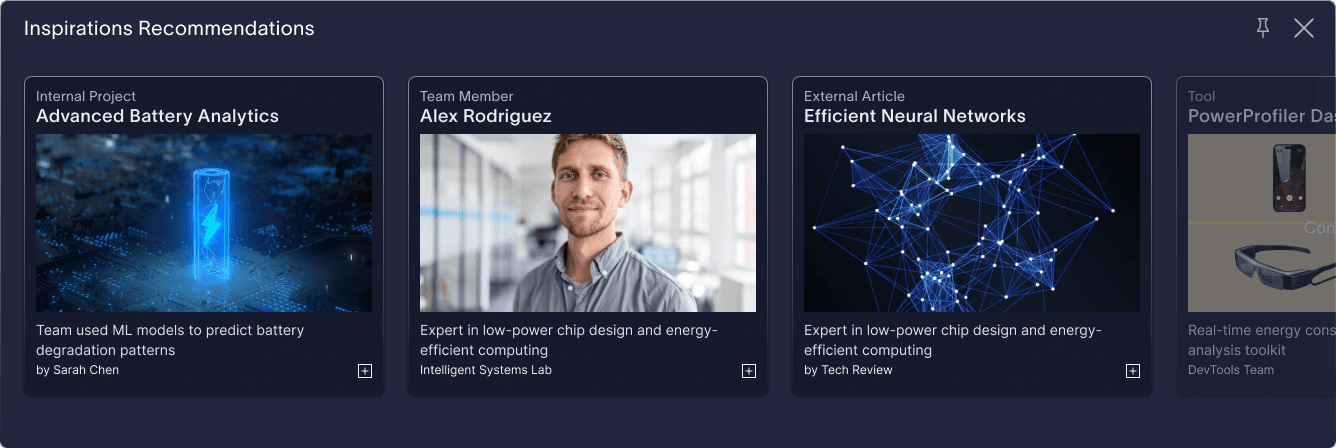
Inspiration Prompt:

  • Inspire user about what question to ask

  • Presentation of popular questions

  • Build mental model of how the system work

Inspiration Prompt:

  • Inspire user about what question to ask

  • Presentation of popular questions

  • Build mental model of how the system work

Inspiration Prompt:

  • Inspire user about what question to ask

  • Presentation of popular questions

  • Build mental model of how the system work

Intelligent Search & Filters:

Help user ask better questions by:

  • Evaluating if the system has enough parameters from user input

    • Ask follow up questions and give suggestions on refinement

Intelligent Search & Filters:

Help user ask better questions by:

  • Evaluating if the system has enough parameters from user input

    • Ask follow up questions and give suggestions on refinement

Intelligent Search & Filters:

Help user ask better questions by:

  • Evaluating if the system has enough parameters from user input

    • Ask follow up questions and give suggestions on refinement

The interactive timeline serves as both a filter and a line graph that indicates change in activity over time.

The interactive timeline serves as both a filter and a line graph that indicates change in activity over time.

The interactive timeline serves as both a filter and a line graph that indicates change in activity over time.

See projects with related domains, tech, team easily

See projects with related domains, tech, team easily

See projects with related domains, tech, team easily

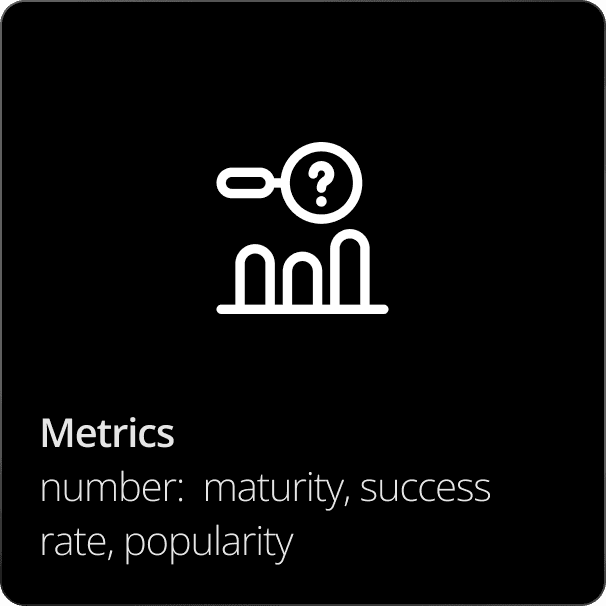
visual parameter

Mapped to

What’s needed to implement

Planet size

effort invested (time or money)

Actual effort metrics based on e.g. time and money

Star Brightness

Impact or visibility

quantitive impact score, or stakeholder priority

Rotation speed (within the trail or self-rotation)

Update frequency within stages, major updates

More granular way of documenting updates in projects

Split off trails

if multiple spin-off projects emerged from an original one

More relationship data to indicate relationships between projects

Satellite (Level 3 Category)

work (tech evaluation, partner, spin off) that supported that specific projects

Evaluation of DataOS

Planet shape

Entity type

Project, tech evaluation, partner

Domain star cluster

Product sub concepts

product line-features

Our approach enables adaptive interfaces through conversational feedback. Users can directly express what they want to track or explore.

By entering their goal or question into a prompt input box, the system performs intent tagging to categorize the query and automatically surfaces the most relevant UI components.

Step 1: Intent Tagging: Understanding the ask
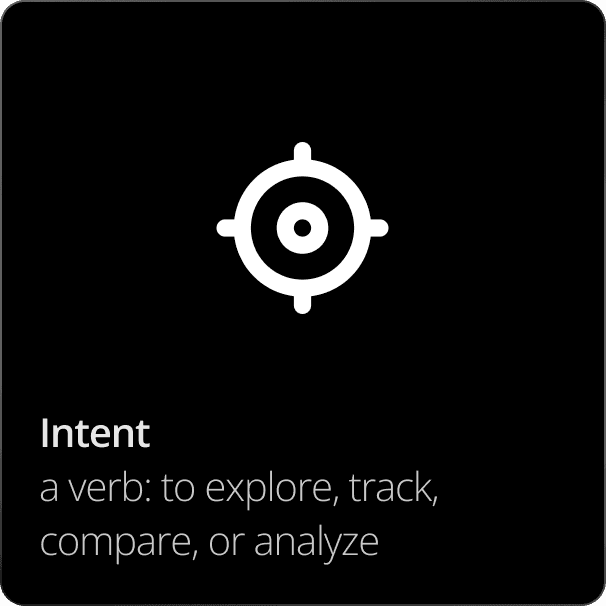
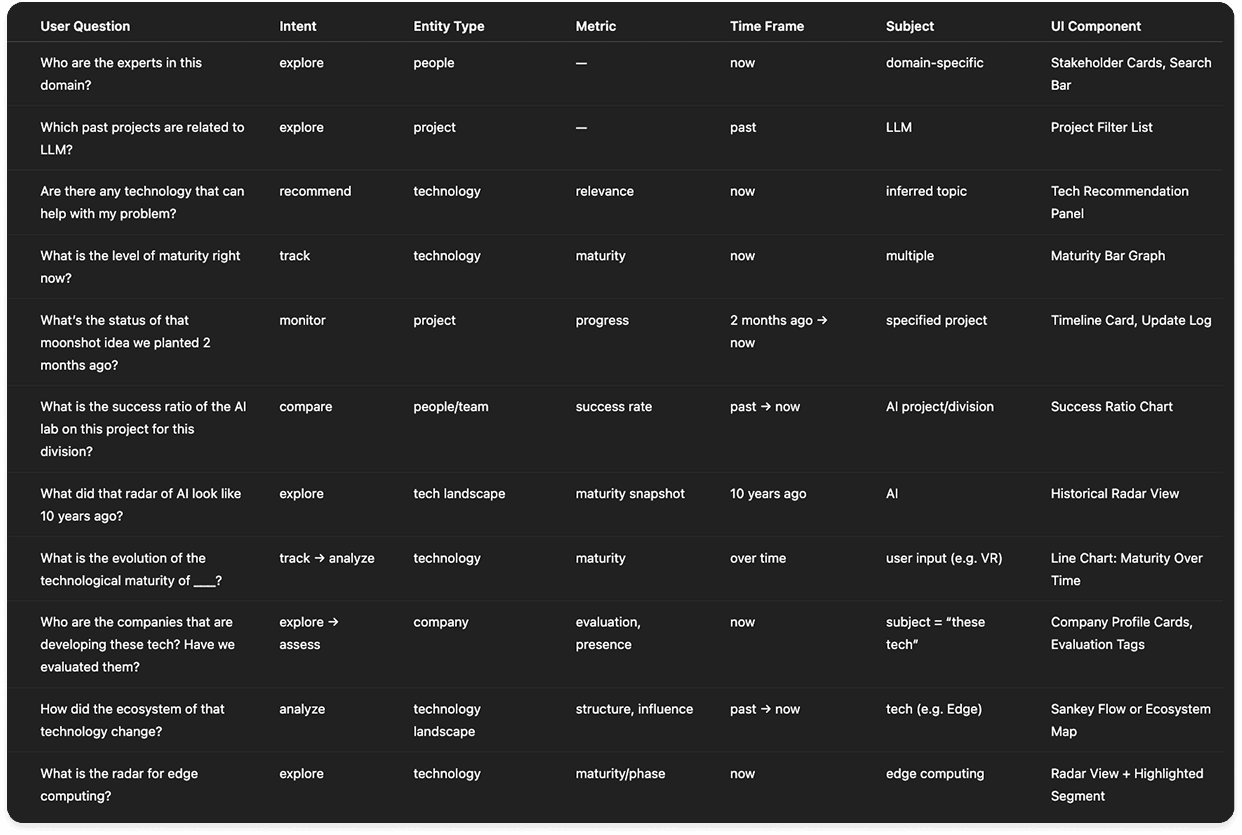
On interpreting the user input side, I defined 5 parameters to tag a questions.

On interpreting the user input side, I defined 5 parameters to tag a questions.

On interpreting the user input side, I defined 5 parameters to tag a questions.

For example ☝️

How did I come up with these parameters? Why?

How did I come up with these parameters? Why?

How did I come up with these parameters? Why?

During the user interview, I asked each interviewee: " If you can ask the galaxy page any question, what would you ask?" and looked for recurring patterns in what they were fundamentally asking for.

While an LLM could infer UI responses directly, defining a parameter tagging framework adds a structured, interpretable layer between user intent and system response. Putting LLM on rails as oppose to letting it range free.

Step 2: UI Matching: How to Answer with Different UI Components

On the system output side, for each of the potential intent, I have a set of corresponding UI components to answer.

On the system output side, for each of the potential intent, I have a set of corresponding UI components to answer.

On the system output side, for each of the potential intent, I have a set of corresponding UI components to answer.

A white and gray background with a gradient of black dots

01

A white and gray background with a gradient of black dots

03

A white and gray background with a gradient of black dots

02

A white and gray background with a gradient of black dots

04

A white and gray background with a gradient of black dots

01

A white and gray background with a gradient of black dots

02

A white and gray background with a gradient of black dots

03

A white and gray background with a gradient of black dots

04

For example, for "Discover" intent, an UI component like this be fetched☝️

Step 3: Curate Dashboard Space with Feedback

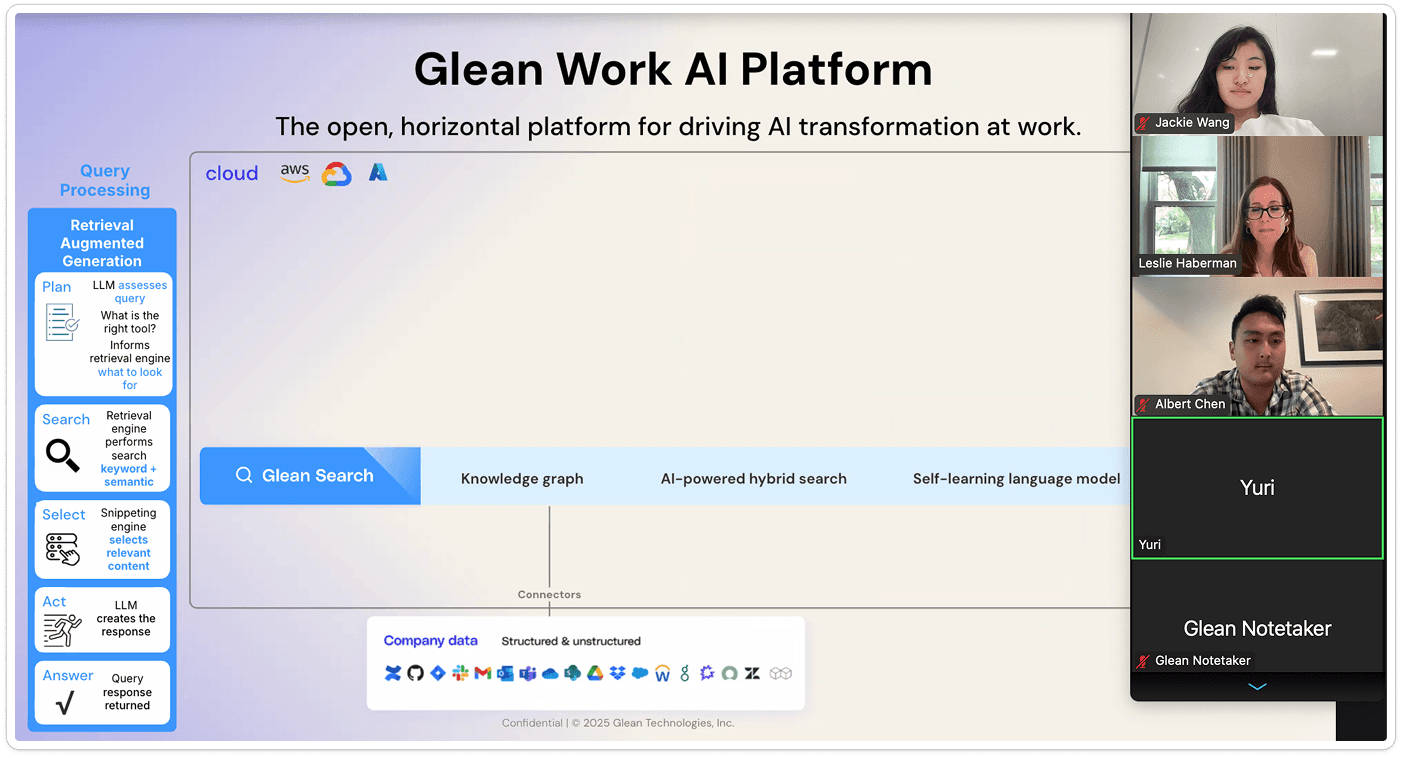
During the process of brainstorming how to leverage the power of LLM to empower better search, I talked to a start up company called glean, which provides a software that combines all source of information across platforms and domain and fuse them into smart search that's specific to the company.
Reflection